

Understanding Purity Percentages
AT A GLANCE
reading time 4-5 minutes
You’ll Learn
- What a purity percentage actually represents
- How chromatographic purity is commonly measured using HPLC
- Why purity percentage and total material composition are not the same thing
- Why water, counterions, and other components may require separate analytical testing
- Why 100% purity is rarely reported
- Why purity results can differ between tests or laboratories
- How to interpret purity in the context of a complete Certificate of Analysis
Understanding Purity Percentages
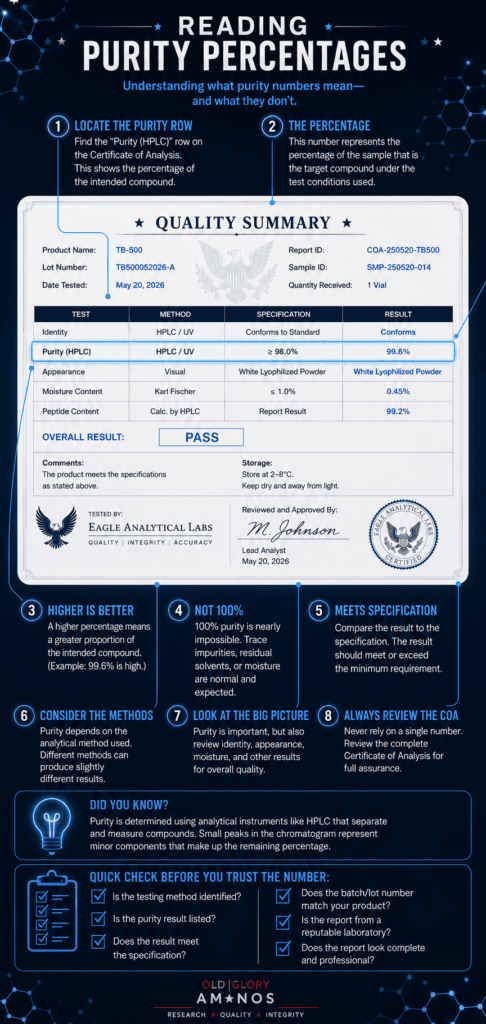
Purity percentages are often one of the first values researchers notice when reviewing analytical results. A number such as 99% may appear straightforward, but understanding what that percentage actually measures—and what it does not—is essential for interpreting the result correctly.
For amino compounds, purity is commonly evaluated using analytical techniques such as High-Performance Liquid Chromatography (HPLC). When reported as HPLC area purity, the percentage reflects the relative chromatographic signal associated with the primary compound compared with other detected components under the conditions of that analysis.
That makes purity an important piece of analytical information—but not a complete description of everything present in the material.
⚠️ IMPORTANT DISTINCTION
A high purity percentage should not automatically be interpreted as the percentage of the vial’s total physical mass made up by the target compound. Chromatographic purity and total material composition are different measurements.
What Does Purity Mean?
When a COA reports HPLC purity, the percentage typically describes the relative amount of chromatographic signal attributed to the primary compound compared with other detected components included in the analysis.
For example, if an HPLC analysis reports 99% purity, the primary peak accounts for approximately 99% of the integrated chromatographic signal used in that calculation. The remaining area generally represents other detected peaks under those testing conditions.
This is why the analytical method matters. A purity percentage describes the sample through the lens of a particular analysis—it is not automatically a complete inventory of everything physically present in the material.
📊 READING THE DATA
If a COA reports 99.4% HPLC purity, read that as a chromatographic result: approximately 99.4% of the integrated peak area used in the calculation was attributed to the primary component. Don’t translate it directly into “99.4% of the vial’s mass is the target compound.”
Purity also does not measure a compound’s effectiveness, biological activity, or performance. It describes a specific analytical characteristic of the tested sample.
How Is Purity Measured?
For amino compounds, chromatographic purity is commonly evaluated using High-Performance Liquid Chromatography (HPLC) or closely related techniques such as UHPLC.
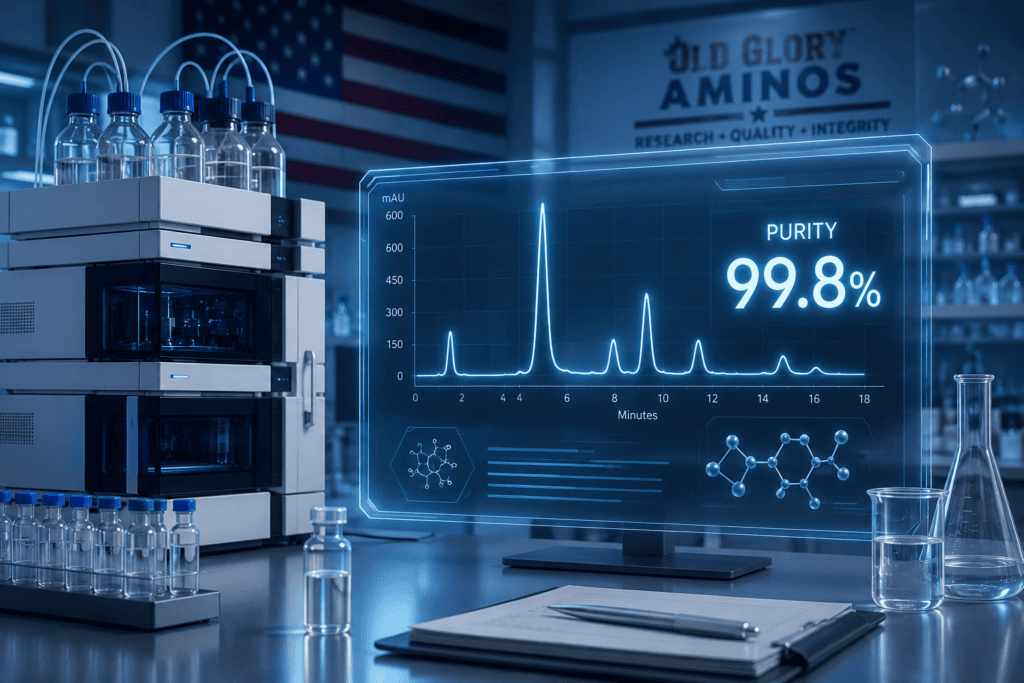
During HPLC analysis, components of a sample are separated as they travel through the chromatographic system. A detector records the resulting signals as peaks on a chromatogram, and the relative areas of those peaks can be used to calculate chromatographic purity.
A large primary peak generally represents the principal detected component, while smaller peaks may represent additional components detected under the conditions of the method.
🔬 RESEARCH NOTE
Not every analytical technique answers the same question. HPLC is commonly used to evaluate chromatographic purity, while mass spectrometry is often used to provide evidence about molecular identity. These methods can complement one another, but their results should not be interpreted as interchangeable measurements of purity.
For a deeper look at the science behind the analysis, see What Is HPLC?, How to Read an HPLC Chromatogram, and HPLC vs. Mass Spectrometry.
Purity Is Not the Same as Total Material Composition
One of the most important distinctions when interpreting analytical data is the difference between chromatographic purity and total material composition.
An HPLC area-purity result compares the relative signals detected and included in the chromatographic calculation. It does not necessarily account for every component contributing to the physical mass of the material.
For example, a sample may also contain water, counterions, residual solvents, inorganic salts, or other components that are not represented—or are not represented in the same way—by the reported HPLC area-purity percentage. Evaluating those components may require separate analytical methods.
This means a material reporting 99% HPLC purity should not automatically be interpreted as containing 99% target compound by total mass.
⚠️ IMPORTANT DISTINCTION
Purity asks: How dominant is the primary component within this chromatographic analysis?
Total composition asks: What actually makes up the physical material, and in what amounts?
Those are related questions, but they are not the same measurement.
🔬 RESEARCH NOTE
This distinction is one reason multiple analytical techniques may be used to characterize the same material. No single purity percentage provides a complete chemical inventory of a sample.
Why Isn’t Every Compound 100% Pure?
In real-world analytical testing, 100% chromatographic purity is uncommon.
During synthesis, purification, processing, and storage, small amounts of related compounds or degradation products may be present. An HPLC analysis may detect some of these components as minor peaks alongside the primary peak.
Their presence does not automatically indicate a problem. What matters is what was detected, how much was detected, and whether the result meets the appropriate specification for that material and analysis.
A purity result such as 99.2% rather than 100% does not necessarily mean the remaining 0.8% represents a single identifiable impurity. The remaining chromatographic area may consist of multiple minor detected peaks, and determining what those peaks actually represent can require additional analysis.
For more on interpreting minor peaks, see How to Read an HPLC Chromatogram.
Why Purity Results Can Differ Between Tests or Laboratories
Two analyses of the same material may produce slightly different purity results without either result necessarily being incorrect.
Differences can arise from factors such as:
- Sample preparation
- Chromatographic conditions
- Column and detector settings
- Data processing and peak integration
- The analytical method or procedure used
Even small differences in how peaks are detected and integrated can affect the final reported percentage.
📊 READING THE DATA
When comparing purity results, don’t look at the percentages alone. Check whether the analyses used comparable methods and testing conditions. A result of 99.1% from one analysis and 99.5% from another may not represent a meaningful change in the material if the underlying methods differ.
🔬 RESEARCH NOTE
Analytical results are most useful when interpreted alongside the method used to generate them, rather than treating the reported percentage as an isolated number.
Key Takeaways
- A purity percentage must be interpreted in the context of the analytical method used to generate it.
- With HPLC area purity, the reported percentage reflects the relative chromatographic signal attributed to the primary component—not necessarily its percentage of the material’s total physical mass.
- Chromatographic purity and total material composition are different measurements. Water, counterions, residual solvents, and other components may require separate analytical methods to evaluate.
- Minor peaks and results below 100% are not automatically signs of poor quality; they must be interpreted in the context of the method, specification, and analytical data.
- Purity results are most meaningful when considered alongside the COA and other complementary analytical testing, rather than as an isolated number.
Continue Your Research....
3X vs 15X Testing
What is HPLC?
How to Read an HPLC Chromatogram
HPLC vs Mass Spectrometry
Sterility vs Endotoxin Testing
References and Further Reading
United States Pharmacopeia (USP). General Chapter <621> Chromatography. USP–NF.
Provides the foundational principles of chromatographic separation, including HPLC, and supports our explanation of chromatographic analysis and interpretation of chromatographic data.
USP — General Chapter <621> ChromatographyInternational Council for Harmonisation (ICH). Q2(R2): Validation of Analytical Procedures. Final Guidance, March 2024.
Establishes current principles for analytical procedure validation and reinforces why analytical results must be interpreted in the context of the method and its intended purpose.
FDA — ICH Q2(R2) Validation of Analytical ProceduresInternational Council for Harmonisation (ICH). Q6A: Specifications: Test Procedures and Acceptance Criteria for New Drug Substances and New Drug Products.
Particularly useful for this article because it distinguishes assay/content, identification, impurities, water content, and other quality attributes as separate analytical characteristics rather than treating a single purity measurement as complete characterization.
FDA — ICH Q6A Specifications and Acceptance CriteriaUnited States Pharmacopeia (USP). General Chapter <921> Water Determination. USP–NF, 2025.
Supports our new discussion of why water content is a separate analytical measurement and should not simply be inferred from an HPLC purity percentage. USP describes dedicated methods for determining water, including titrimetric, azeotropic, and gravimetric approaches.
USP — General Chapter <921> Water DeterminationInternational Council for Harmonisation (ICH). Q3C(R9): Impurities — Guideline for Residual Solvents.
Provides additional support for our point that residual solvents represent a distinct component of material composition requiring appropriate evaluation, rather than something that can automatically be derived f
ICH — Q3C(R9) Guideline for Residual Solvents
Research Disclaimer
The information provided in this guide is intended solely for educational and research purposes. It is designed to help readers understand common laboratory analytical terminology and should not be interpreted as medical advice or as a statement regarding the safety, efficacy, or intended use of any research material.
Understanding Purity Percentages
At a Glance
Reading Time: 4-5 minutes
You’ll Learn
- What a purity percentage actually represents
- How chromatographic purity is commonly measured using HPLC
- Why purity percentage and total material composition are not the same thing
- Why water, counterions, and other components may require separate analytical testing
- Why 100% purity is rarely reported
- Why purity results can differ between tests or laboratories
- How to interpret purity in the context of a complete Certificate of Analysis
Understanding Purity Percentages
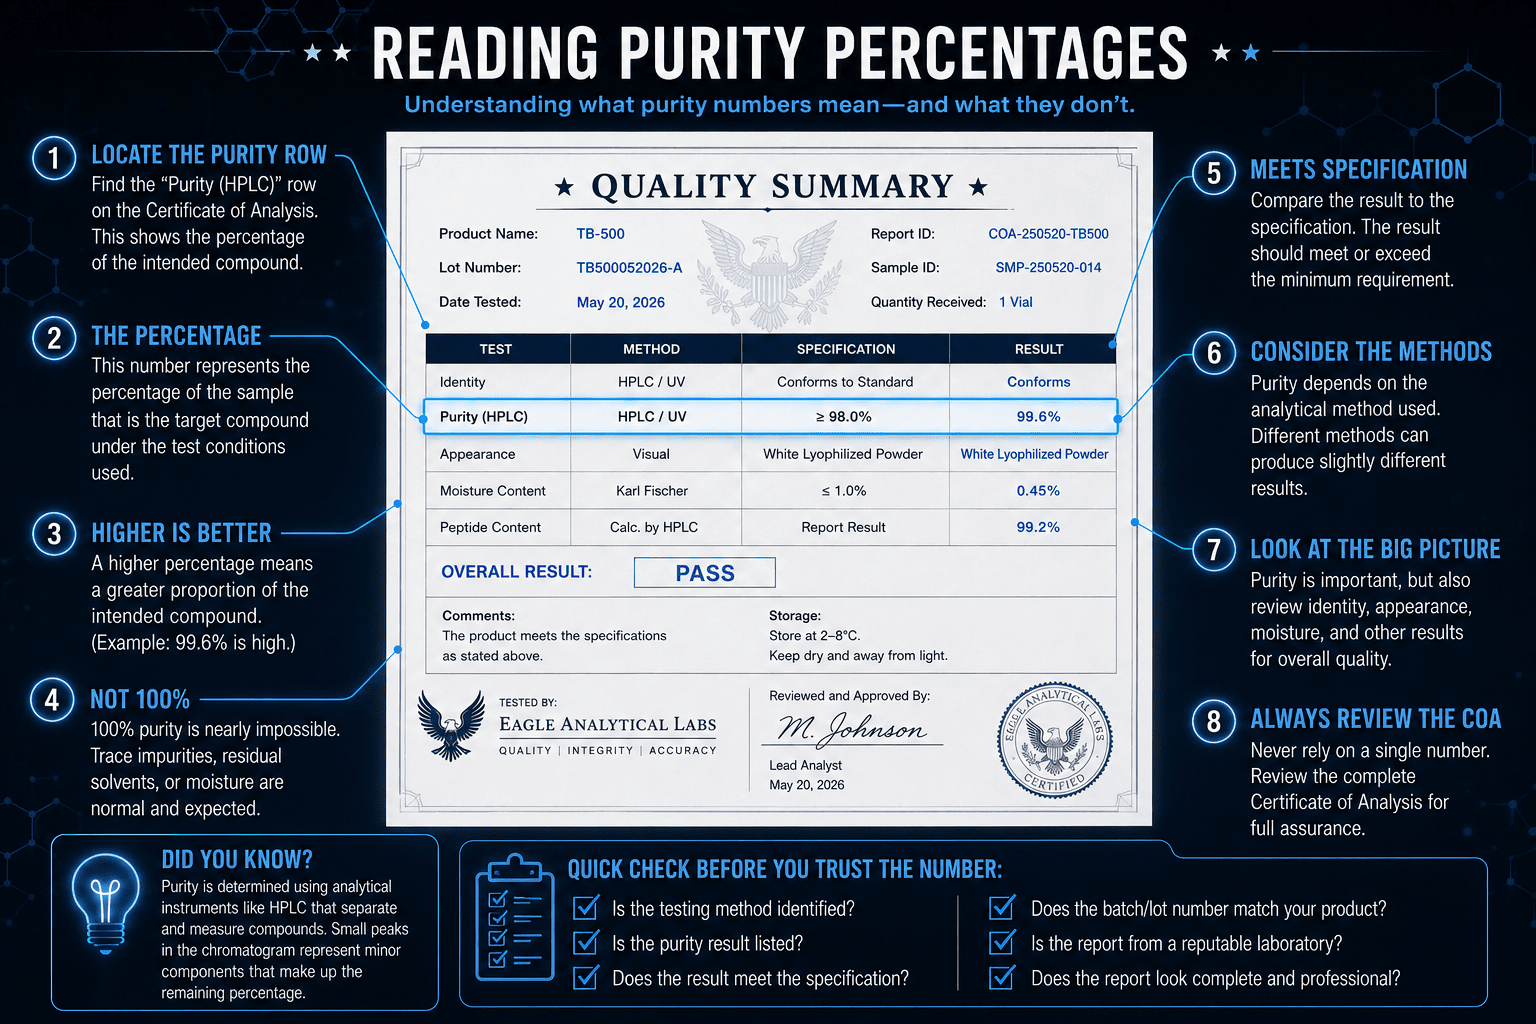
Purity percentages are often one of the first values researchers notice when reviewing analytical results. A number such as 99% may appear straightforward, but understanding what that percentage actually measures—and what it does not—is essential for interpreting the result correctly.
For amino compounds, purity is commonly evaluated using analytical techniques such as High-Performance Liquid Chromatography (HPLC). When reported as HPLC area purity, the percentage reflects the relative chromatographic signal associated with the primary compound compared with other detected components under the conditions of that analysis.
That makes purity an important piece of analytical information—but not a complete description of everything present in the material.
⚠️ IMPORTANT DISTINCTION
A high purity percentage should not automatically be interpreted as the percentage of the vial’s total physical mass made up by the target compound. Chromatographic purity and total material composition are different measurements.
What Does Purity Mean?
When a COA reports HPLC purity, the percentage typically describes the relative amount of chromatographic signal attributed to the primary compound compared with other detected components included in the analysis.
For example, if an HPLC analysis reports 99% purity, the primary peak accounts for approximately 99% of the integrated chromatographic signal used in that calculation. The remaining area generally represents other detected peaks under those testing conditions.
This is why the analytical method matters. A purity percentage describes the sample through the lens of a particular analysis—it is not automatically a complete inventory of everything physically present in the material.
📊 READING THE DATA
If a COA reports 99.4% HPLC purity, read that as a chromatographic result: approximately 99.4% of the integrated peak area used in the calculation was attributed to the primary component. Don’t translate it directly into “99.4% of the vial’s mass is the target compound.”
Purity also does not measure a compound’s effectiveness, biological activity, or performance. It describes a specific analytical characteristic of the tested sample.
How Is Purity Measured?
For amino compounds, chromatographic purity is commonly evaluated using High-Performance Liquid Chromatography (HPLC) or closely related techniques such as UHPLC.
During HPLC analysis, components of a sample are separated as they travel through the chromatographic system. A detector records the resulting signals as peaks on a chromatogram, and the relative areas of those peaks can be used to calculate chromatographic purity.
A large primary peak generally represents the principal detected component, while smaller peaks may represent additional components detected under the conditions of the method.
🔬 RESEARCH NOTE
Not every analytical technique answers the same question. HPLC is commonly used to evaluate chromatographic purity, while mass spectrometry is often used to provide evidence about molecular identity. These methods can complement one another, but their results should not be interpreted as interchangeable measurements of purity.
For a deeper look at the science behind the analysis, see What Is HPLC?, How to Read an HPLC Chromatogram, and HPLC vs. Mass Spectrometry.
Purity Is Not the Same as Total Material Composition
One of the most important distinctions when interpreting analytical data is the difference between chromatographic purity and total material composition.
An HPLC area-purity result compares the relative signals detected and included in the chromatographic calculation. It does not necessarily account for every component contributing to the physical mass of the material.
For example, a sample may also contain water, counterions, residual solvents, inorganic salts, or other components that are not represented—or are not represented in the same way—by the reported HPLC area-purity percentage. Evaluating those components may require separate analytical methods.
This means a material reporting 99% HPLC purity should not automatically be interpreted as containing 99% target compound by total mass.
⚠️ IMPORTANT DISTINCTION
Purity asks: How dominant is the primary component within this chromatographic analysis?
Total composition asks: What actually makes up the physical material, and in what amounts?
Those are related questions, but they are not the same measurement.
🔬 RESEARCH NOTE
This distinction is one reason multiple analytical techniques may be used to characterize the same material. No single purity percentage provides a complete chemical inventory of a sample.
Why Isn’t Every Compound 100% Pure?
In real-world analytical testing, 100% chromatographic purity is uncommon.
During synthesis, purification, processing, and storage, small amounts of related compounds or degradation products may be present. An HPLC analysis may detect some of these components as minor peaks alongside the primary peak.
Their presence does not automatically indicate a problem. What matters is what was detected, how much was detected, and whether the result meets the appropriate specification for that material and analysis.
A purity result such as 99.2% rather than 100% does not necessarily mean the remaining 0.8% represents a single identifiable impurity. The remaining chromatographic area may consist of multiple minor detected peaks, and determining what those peaks actually represent can require additional analysis.
For more on interpreting minor peaks, see How to Read an HPLC Chromatogram.
Why Purity Results Can Differ Between Tests or Laboratories
Two analyses of the same material may produce slightly different purity results without either result necessarily being incorrect.
Differences can arise from factors such as:
- Sample preparation
- Chromatographic conditions
- Column and detector settings
- Data processing and peak integration
- The analytical method or procedure used
Even small differences in how peaks are detected and integrated can affect the final reported percentage.
📊 READING THE DATA
When comparing purity results, don’t look at the percentages alone. Check whether the analyses used comparable methods and testing conditions. A result of 99.1% from one analysis and 99.5% from another may not represent a meaningful change in the material if the underlying methods differ.
🔬 RESEARCH NOTE
Analytical results are most useful when interpreted alongside the method used to generate them, rather than treating the reported percentage as an isolated number.
Key Takeaways
- A purity percentage must be interpreted in the context of the analytical method used to generate it.
- With HPLC area purity, the reported percentage reflects the relative chromatographic signal attributed to the primary component—not necessarily its percentage of the material’s total physical mass.
- Chromatographic purity and total material composition are different measurements. Water, counterions, residual solvents, and other components may require separate analytical methods to evaluate.
- Minor peaks and results below 100% are not automatically signs of poor quality; they must be interpreted in the context of the method, specification, and analytical data.
- Purity results are most meaningful when considered alongside the COA and other complementary analytical testing, rather than as an isolated number.
Continue Your Research....
3X vs 15X Testing
What is HPLC?
How to Read an HPLC Chromatogram
HPLC vs Mass Spectrometry
Sterility vs Endotoxin Testing
References and Further Reading
United States Pharmacopeia (USP). General Chapter <621> Chromatography. USP–NF.
Provides the foundational principles of chromatographic separation, including HPLC, and supports our explanation of chromatographic analysis and interpretation of chromatographic data.
USP — General Chapter <621> ChromatographyInternational Council for Harmonisation (ICH). Q2(R2): Validation of Analytical Procedures. Final Guidance, March 2024.
Establishes current principles for analytical procedure validation and reinforces why analytical results must be interpreted in the context of the method and its intended purpose.
FDA — ICH Q2(R2) Validation of Analytical ProceduresInternational Council for Harmonisation (ICH). Q6A: Specifications: Test Procedures and Acceptance Criteria for New Drug Substances and New Drug Products.
Particularly useful for this article because it distinguishes assay/content, identification, impurities, water content, and other quality attributes as separate analytical characteristics rather than treating a single purity measurement as complete characterization.
FDA — ICH Q6A Specifications and Acceptance CriteriaUnited States Pharmacopeia (USP). General Chapter <921> Water Determination. USP–NF, 2025.
Supports our new discussion of why water content is a separate analytical measurement and should not simply be inferred from an HPLC purity percentage. USP describes dedicated methods for determining water, including titrimetric, azeotropic, and gravimetric approaches.
USP — General Chapter <921> Water DeterminationInternational Council for Harmonisation (ICH). Q3C(R9): Impurities — Guideline for Residual Solvents.
Provides additional support for our point that residual solvents represent a distinct component of material composition requiring appropriate evaluation, rather than something that can automatically be derived f
ICH — Q3C(R9) Guideline for Residual Solvents
Research Disclaimer
The information provided in this guide is intended solely for educational and research purposes. It is designed to help readers understand common laboratory analytical terminology and should not be interpreted as medical advice or as a statement regarding the safety, efficacy, or intended use of any research material.