

How to Read an HPLC Chromatogram
AT A GLANCE
Reading Time: 8–10 minutes
You’ll Learn
You’ll Learn
- How to read the X- and Y-axes of an HPLC chromatogram
- What the baseline and individual peaks represent
- How retention time is interpreted
- How peak area and integration relate to reported chromatographic purity
- What minor and overlapping peaks can reveal
- Why resolution and peak shape matter
- What an HPLC chromatogram can—and cannot—tell you about a sample
Introduction
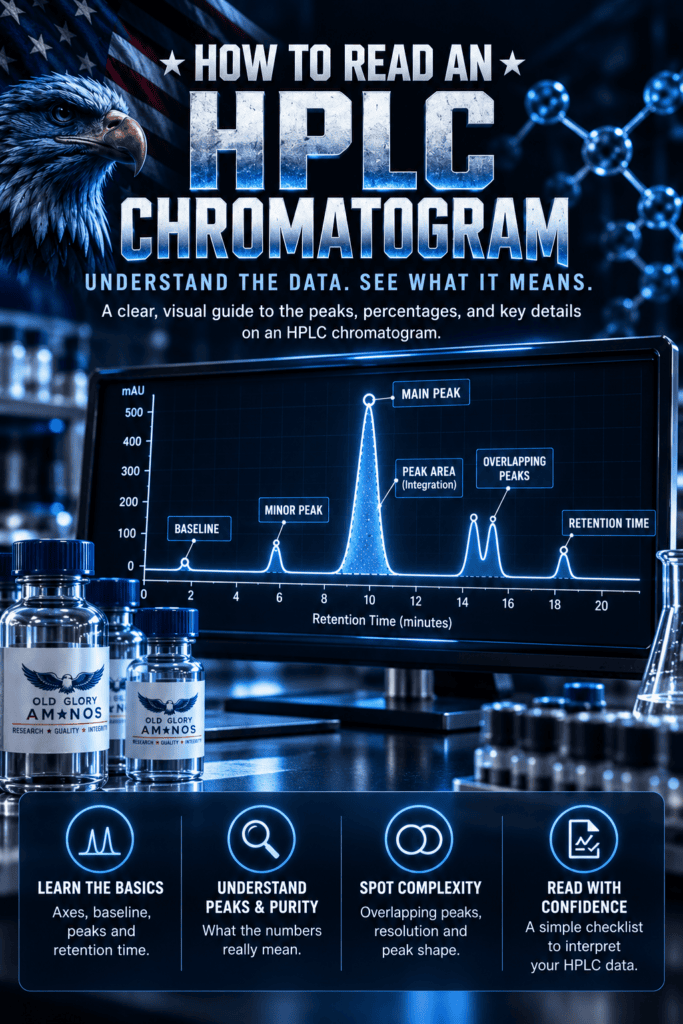
An HPLC chromatogram can look intimidating at first—a flat line interrupted by a collection of peaks, numbers, and unfamiliar measurements. But once you understand what those features represent, the graph becomes much easier to interpret.
Each peak is part of the analytical story of a sample. Where a peak appears, how large it is, how well it separates from neighboring peaks, and how the software integrates it all contribute to the information researchers can obtain from an HPLC analysis.
The important part is knowing what conclusions the chromatogram actually supports. A dominant peak may contribute to a high reported chromatographic purity percentage, but that number does not automatically establish identity, total material content, sterility, or the absence of every possible contaminant.
In this guide, we’ll break down an HPLC chromatogram piece by piece—from the axes and baseline to retention time, peak area, integration, and resolution—so you can understand not only what you’re looking at, but what the data actually means.
A Quick HPLC Refresher
High-performance liquid chromatography (HPLC) is an analytical technique used to separate components within a sample so they can be detected and measured individually.
As a sample moves through an HPLC column, its components travel at different rates. As they leave the column and pass through the detector, the instrument records a signal over time.
That recorded signal becomes the chromatogram—a visual record of the separation.
The horizontal axis shows when detector responses occurred, while the vertical axis shows the strength of the detector response. When the signal rises, it forms a chromatographic peak.
This guide focuses on how to read and interpret that graph.
Want to understand the full HPLC process first?
See our What Is HPLC? guide for a step-by-step explanation of HPLC separation and detection.
That’s a better cut than simply deleting random sentences. We eliminate the separate “From Separation to Chromatogram” subsection entirely, because the next section immediately teaches the axes in detail anyway.
Nothing scientifically important is lost. We go from roughly 170 words to about 110, and the reader gets to the actual subject of the article faster.
I’d make that our first trim.
Start With the Axes: X and Y
Before interpreting individual peaks, start with the simplest part of the chromatogram: the two axes.
The X-Axis: Retention Time
The horizontal, or X-axis, represents time—usually measured in minutes.
After a sample is introduced into the HPLC system, its components travel through the column at different rates. The time between injection and detection of a component is its retention time.
A peak appearing at 3.2 minutes therefore represents a detector response occurring earlier in the analysis than a peak appearing at 7.8 minutes.
Retention time can be useful when comparing chromatograms produced under the same analytical conditions, but it should not be treated as a unique molecular fingerprint. Changes in the column, mobile phase, flow rate, temperature, or other method conditions can affect when a component elutes.
The Y-Axis: Detector Response
The vertical, or Y-axis, represents the response generated by the detector.
The exact units depend on the detector and analytical method being used. With UV-based HPLC detection, for example, the signal may be reported in absorbance units or milli-absorbance units (mAU).
As material passing through the detector produces a stronger response, the plotted signal rises. When that response returns toward its normal background level, the trace falls back toward the baseline.
This rise and fall creates the familiar chromatographic peak.
📊 READING THE DATA
A useful way to orient yourself is to read a chromatogram as “detector response over time.”Left to right: When did the detector respond?
Bottom to top: How strong was the response?That simple framework makes the rest of the graph much easier to understand.
⚠️ IMPORTANT DISTINCTION
A taller peak does not automatically mean there is proportionally more of that substance in the sample. Detector response can vary between different compounds, and quantitative comparisons may require calibration or appropriate response factors.This becomes especially important when we discuss peak area, integration, and reported purity percentages later in this guide.
The Baseline: Where the Signal Begins
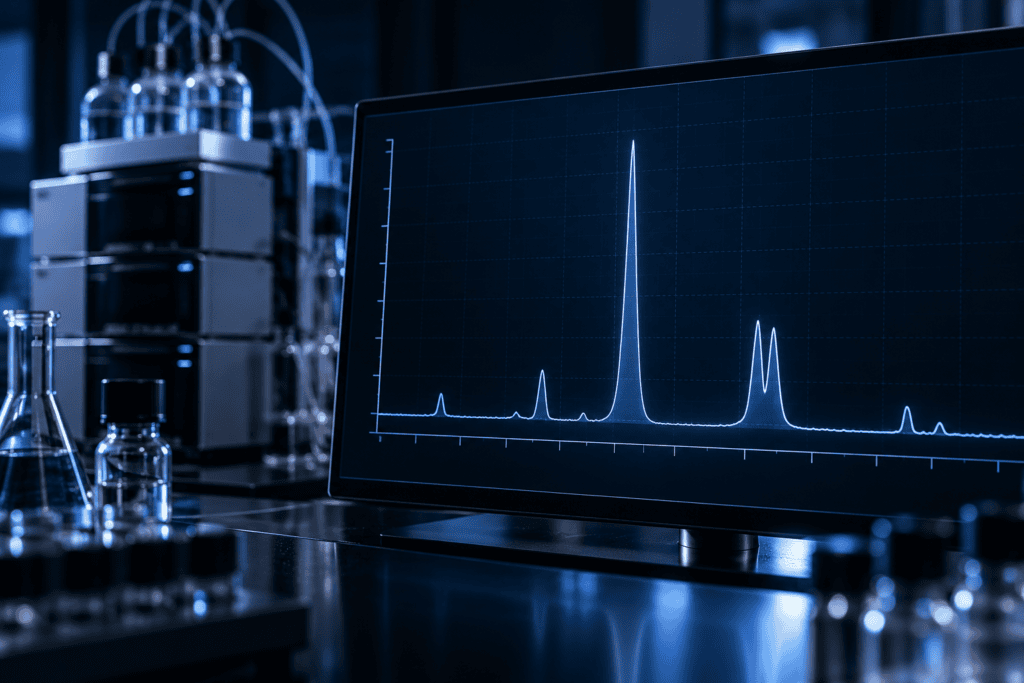
Running beneath the peaks of a chromatogram is the baseline—the detector signal recorded when no significant analyte peak is passing through the detector.
A baseline is rarely perfectly flat. Baseline noise appears as small, rapid fluctuations in the signal, while baseline drift is a gradual movement upward or downward during the analysis. Some variation is normal, but excessive noise or drift can make small peaks more difficult to distinguish and measure reliably.
The baseline also helps determine where a peak begins and ends, which matters when chromatography software calculates the integrated area of a peak.
📊 READING THE DATA
Don’t look only at the tallest peak. Look underneath it.Ask: Is the baseline reasonably stable? Are smaller peaks clearly distinguishable from background noise?
A perfectly flat baseline isn’t required—the important question is whether baseline variation interferes with reliable detection and integration of the peaks being evaluated.
Understanding the Peaks
The peaks are the most recognizable features of an HPLC chromatogram—and usually the first place your eyes go.
A peak forms when material leaving the column produces an increased detector response. As the response rises, reaches a maximum, and falls again, it creates the characteristic chromatographic peak.
Ideally, a well-resolved peak corresponds primarily to one component separated from the others in the sample. A chromatogram may contain one dominant peak along with several smaller peaks, or many peaks of different sizes and retention times.
But interpreting them isn’t as simple as counting peaks.
⚠️ IMPORTANT DISTINCTION
One visible peak does not necessarily mean one component.Two substances that leave the column at nearly the same time can produce overlapping responses—a phenomenon known as co-elution. In some cases, those responses may even appear as a single peak.
Peak Height vs. Peak Area
Peak height measures how far the signal rises above the baseline, while peak area considers the detector response across the entire width of the peak.
For chromatographic purity calculations, integrated peak area is generally more important than simply identifying the tallest peak.
We’ll look at exactly how peak area becomes Area% later in this guide.
Retention Time: Where a Peak Appears
Retention time describes how long it takes for a component to travel through the chromatographic system and reach the detector after the sample is introduced.
If a peak reaches its maximum 6.4 minutes into the run, for example, its retention time may be reported as approximately 6.4 minutes.
Different components can have different retention times because they interact differently with the mobile and stationary phases of the HPLC system. However, retention time also depends on the analytical method—including factors such as column chemistry, mobile-phase composition, flow rate, and temperature.
The same compound can appear at different retention times when analyzed using different HPLC methods. The method provides the context for the number.
Can Retention Time Identify a Compound?
When a reference standard and sample are analyzed under the same chromatographic conditions, similar retention behavior can provide evidence supporting identification.
But retention time alone generally cannot establish identity conclusively.
⚠️ IMPORTANT DISTINCTION
Matching retention times do not prove that two substances are identical.Different compounds can sometimes elute at or near the same time. Retention time is therefore best understood as supporting evidence within a defined analytical method, rather than a unique molecular fingerprint.
Peak Area & Integration: Where the Purity Number Comes From
This is where the chromatogram connects to the familiar purity percentage reported on many COAs.
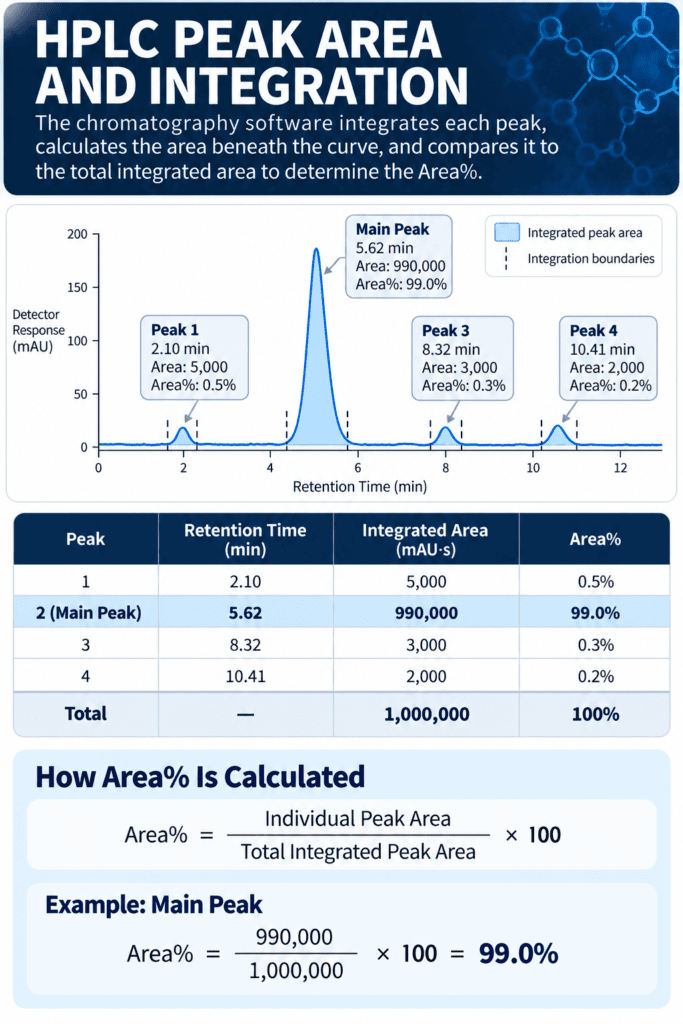
Chromatography software can calculate the area beneath each detected peak, a process called integration. Unlike peak height, integration considers the detector response across the entire width of the peak.
Those integrated areas can then be compared to calculate Area%.
What Is Area%?
In a simplified example, imagine a chromatogram containing four integrated peaks:
| Peak | Integrated Area | Area% |
|---|---|---|
| Main Peak | 990,000 | 99.0% |
| Minor Peak 1 | 5,000 | 0.5% |
| Minor Peak 2 | 3,000 | 0.3% |
| Minor Peak 3 | 2,000 | 0.2% |
| Total | 1,000,000 | 100% |
The main peak accounts for 99% of the total integrated detector response included in the calculation.
Area% = Individual Peak Area ÷ Total Integrated Peak Area × 100
⚠️ IMPORTANT DISTINCTION
99% HPLC Area% does not necessarily mean that 99% of the total material in the sample is the target compound by mass.It means the selected peak accounted for approximately 99% of the integrated chromatographic detector response included in that calculation, under the conditions of that analytical method.
Why Detector Response Matters
Different substances do not necessarily produce identical detector responses. With UV detection, for example, response depends partly on how strongly a compound absorbs light at the wavelength being monitored.
For quantitative measurements, laboratories may use reference standards, calibration curves, or response factors to relate detector response more directly to concentration.
🔬 RESEARCH NOTE
Area% is fundamentally a relative comparison of integrated detector responses. Its meaning depends on the detector, analytical method, integration parameters, and calculation used.
What About Peaks That Aren’t Integrated?
Not every fluctuation in the chromatogram is necessarily included in the calculation. Analytical methods can use detection and integration parameters to distinguish peaks from ordinary baseline noise.
Likewise, a substance that does not produce a response under the detector conditions will not appear simply because it is present.
⚠️ IMPORTANT DISTINCTION
HPLC Area% is not an inventory of every substance present in the material.Water, counterions, some solvents, and other components may require different analytical approaches depending on the method and detector used.
This is why chromatographic purity and total material composition are different analytical concepts.
📊 READING THE DATA
When you see a result such as HPLC Purity: 99.4%, don’t ask only, “Is 99.4% good?”Ask: “What exactly does that 99.4% represent?”
Minor Peaks, Overlapping Peaks & Resolution
Smaller peaks represent additional detector responses occurring during the analysis. Depending on the method and sample, they may be associated with impurities, degradation products, other detectable components, or analytical artifacts.
Their presence alone does not establish what those substances are or whether they are significant.
Where interpretation becomes especially important is when peaks occur close together. Ideally, individual components are separated well enough to produce distinct peaks. When separation is incomplete, peaks may partially overlap, appear as shoulders, or—in some cases—co-elute closely enough to resemble a single peak.
This is where resolution matters. Resolution describes how effectively neighboring chromatographic peaks are separated from one another.
⚠️ IMPORTANT DISTINCTION
One visible peak does not necessarily represent one component. If two substances co-elute, their detector responses may overlap enough to appear as a single chromatographic peak.
📊 READING THE DATA
Don’t judge a chromatogram only by the size of its main peak. Look at the surrounding trace. Are neighboring peaks clearly separated? Are there shoulders or overlapping signals? Are smaller peaks distinguishable from baseline noise?
Key Takeaways
An HPLC chromatogram is a visual record of detector response over time during a chromatographic separation.
The X-axis typically represents retention time, while the Y-axis represents detector response.
Retention time tells you when a component produced a detector response under the specific analytical conditions used. It can support identification, but it does not prove identity on its own.
Peak area measures the integrated detector response associated with a peak and is commonly used to calculate chromatographic Area%.
A reported result such as 99% HPLC Area% does not automatically mean that 99% of the total sample mass is the target compound. It describes the relative integrated detector response included in that analysis.
Minor peaks are not automatically contaminants. Their identity and significance cannot necessarily be determined from the chromatogram alone.
Good resolution helps separate neighboring components so individual peaks can be evaluated more reliably. Overlapping or co-eluting components can complicate interpretation.
A chromatogram should always be interpreted alongside the analytical method and accompanying report, rather than judged by one peak or percentage alone.
🔬 RESEARCH NOTE
HPLC is powerful because it can separate components and reveal their chromatographic behavior—but no single analytical technique answers every question about a sample. Understanding what a test doesn’t establish is just as important as understanding what it does.
Continue Your Research...
What is HPLC?
How to Read a COA
Understanding Purity Percentages
Sterility vs Endotoxin Testing
References & Further Reading
International Union of Pure and Applied Chemistry (IUPAC). Compendium of Chemical Terminology (the “Gold Book”): Chromatography Terminology.
Useful reference for standardized chromatography terminology, including baseline and retention measurements
IUPAC Gold Book
Agilent Technologies. OpenLab CDS Data Analysis Reference Guide.
Technical reference covering chromatographic data analysis, peak integration, peak area measurement, and related calculations.
Agilent OpenLab CDS Data Analysis Reference Guide
U.S. Food and Drug Administration (FDA). Q2(R2) Validation of Analytical Procedures. March 2024.
Current ICH/FDA framework covering validation principles for analytical procedures and the reliability of analytical results.
FDA Q2(R2) Validation of Analytical Procedures
U.S. Food and Drug Administration (FDA). Q14 Analytical Procedure Development. March 2024.
Guidance addressing science-based analytical procedure development and the importance of understanding analytical method performance.
FDA Q14 Analytical Procedure Development
U.S. Food and Drug Administration (FDA). Q6A Specifications: Test Procedures and Acceptance Criteria for New Drug Substances and New Drug Products.
Particularly useful for understanding the distinction between chromatographic retention behavior and chemical identification. FDA specifically notes that identification based solely on a single chromatographic retention time is not considered sufficiently specific.
FDA Q6A Specifications and Test Procedures
U.S. Food and Drug Administration (FDA). Analytical Procedures and Methods Validation for Drugs and Biologics.
Provides broader context for analytical methods used to evaluate identity, strength, quality, purity, and potency and reinforces why analytical results must be interpreted within the capabilities of the method used.
FDA Analytical Procedures and Methods Validation
Research Disclaimer
The information provided in this guide is intended solely for educational and research purposes. It is designed to help readers understand common laboratory analytical terminology and should not be interpreted as medical advice or as a statement regarding the safety, efficacy, or intended use of any research material.
How to Read an HPLC Chromatogram
At a Glance
Reading Time: 8-10 minutes
You’ll Learn
- How to read the X- and Y-axes of an HPLC chromatogram
- What the baseline and individual peaks represent
- How retention time is interpreted
- How peak area and integration relate to reported chromatographic purity
- What minor and overlapping peaks can reveal
- Why resolution and peak shape matter
- What an HPLC chromatogram can—and cannot—tell you about a sample
Introduction
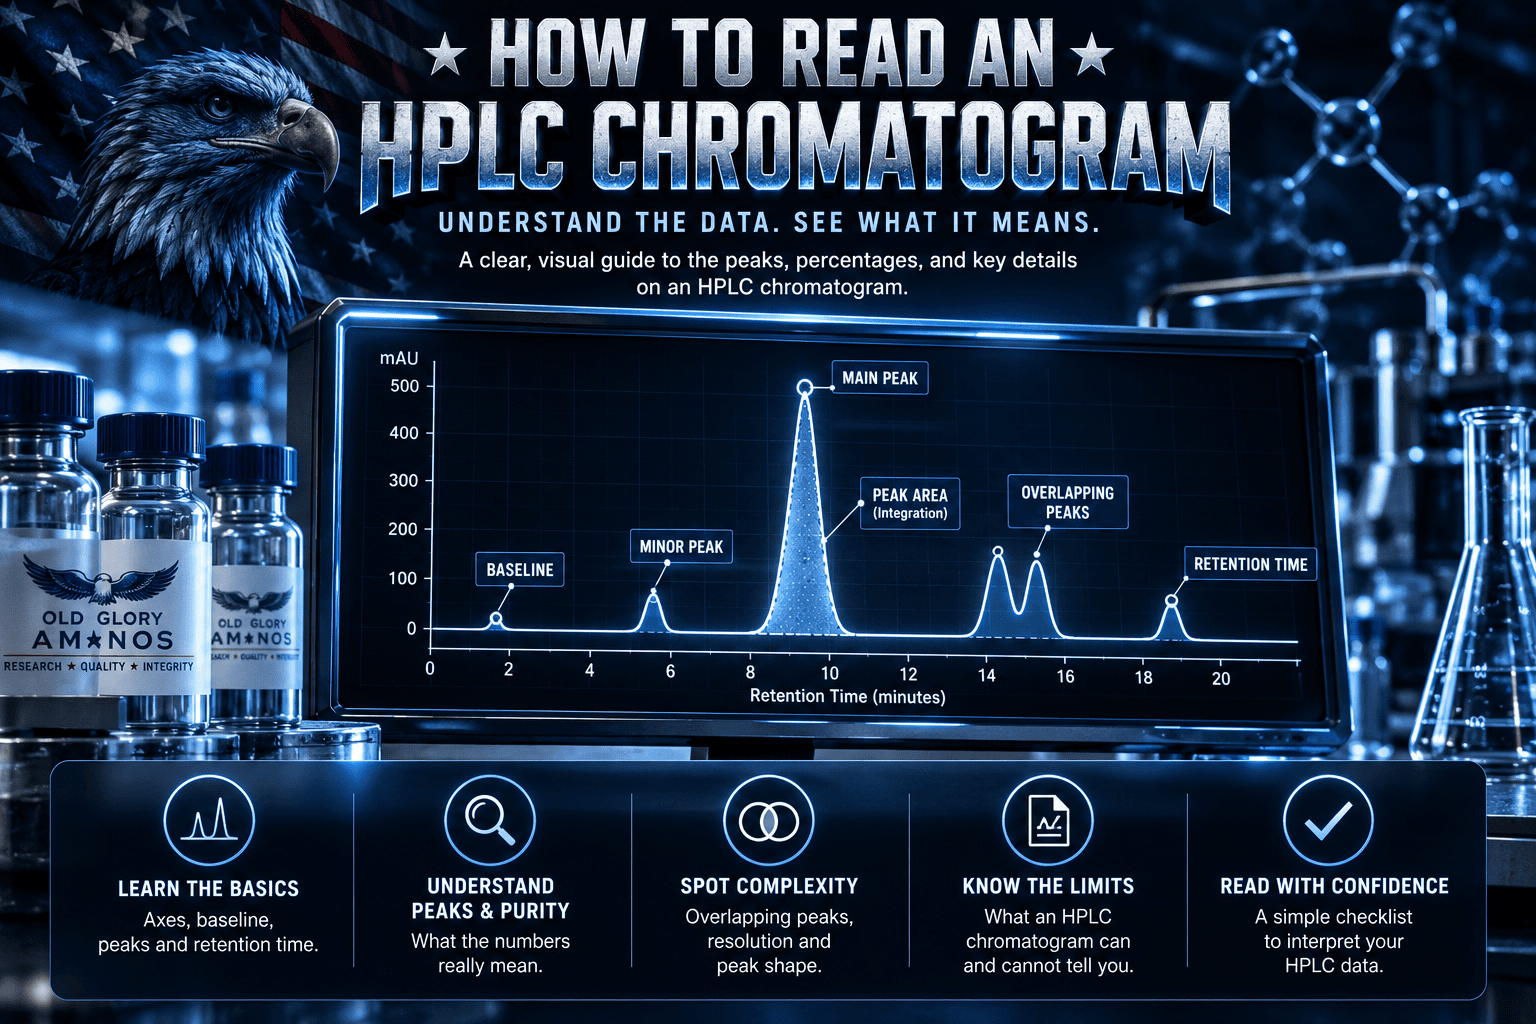
An HPLC chromatogram can look intimidating at first—a flat line interrupted by a collection of peaks, numbers, and unfamiliar measurements. But once you understand what those features represent, the graph becomes much easier to interpret.
Each peak is part of the analytical story of a sample. Where a peak appears, how large it is, how well it separates from neighboring peaks, and how the software integrates it all contribute to the information researchers can obtain from an HPLC analysis.
The important part is knowing what conclusions the chromatogram actually supports. A dominant peak may contribute to a high reported chromatographic purity percentage, but that number does not automatically establish identity, total material content, sterility, or the absence of every possible contaminant.
In this guide, we’ll break down an HPLC chromatogram piece by piece—from the axes and baseline to retention time, peak area, integration, and resolution—so you can understand not only what you’re looking at, but what the data actually means.
A Quick HPLC Refresher
High-performance liquid chromatography (HPLC) is an analytical technique used to separate components within a sample so they can be detected and measured individually.
As a sample moves through an HPLC column, its components travel at different rates. As they leave the column and pass through the detector, the instrument records a signal over time.
That recorded signal becomes the chromatogram—a visual record of the separation.
The horizontal axis shows when detector responses occurred, while the vertical axis shows the strength of the detector response. When the signal rises, it forms a chromatographic peak.
This guide focuses on how to read and interpret that graph.
Want to understand the full HPLC process first?
See our What Is HPLC? guide for a step-by-step explanation of HPLC separation and detection.
That’s a better cut than simply deleting random sentences. We eliminate the separate “From Separation to Chromatogram” subsection entirely, because the next section immediately teaches the axes in detail anyway.
Nothing scientifically important is lost. We go from roughly 170 words to about 110, and the reader gets to the actual subject of the article faster.
I’d make that our first trim.
Start With the Axes: X and Y
Before interpreting individual peaks, start with the simplest part of the chromatogram: the two axes.
The X-Axis: Retention Time
The horizontal, or X-axis, represents time—usually measured in minutes.
After a sample is introduced into the HPLC system, its components travel through the column at different rates. The time between injection and detection of a component is its retention time.
A peak appearing at 3.2 minutes therefore represents a detector response occurring earlier in the analysis than a peak appearing at 7.8 minutes.
Retention time can be useful when comparing chromatograms produced under the same analytical conditions, but it should not be treated as a unique molecular fingerprint. Changes in the column, mobile phase, flow rate, temperature, or other method conditions can affect when a component elutes.
The Y-Axis: Detector Response
The vertical, or Y-axis, represents the response generated by the detector.
The exact units depend on the detector and analytical method being used. With UV-based HPLC detection, for example, the signal may be reported in absorbance units or milli-absorbance units (mAU).
As material passing through the detector produces a stronger response, the plotted signal rises. When that response returns toward its normal background level, the trace falls back toward the baseline.
This rise and fall creates the familiar chromatographic peak.
📊 READING THE DATA
A useful way to orient yourself is to read a chromatogram as “detector response over time.”Left to right: When did the detector respond?
Bottom to top: How strong was the response?That simple framework makes the rest of the graph much easier to understand.
⚠️ IMPORTANT DISTINCTION
A taller peak does not automatically mean there is proportionally more of that substance in the sample. Detector response can vary between different compounds, and quantitative comparisons may require calibration or appropriate response factors.This becomes especially important when we discuss peak area, integration, and reported purity percentages later in this guide.
The Baseline: Where the Signal Begins
Running beneath the peaks of a chromatogram is the baseline—the detector signal recorded when no significant analyte peak is passing through the detector.
A baseline is rarely perfectly flat. Baseline noise appears as small, rapid fluctuations in the signal, while baseline drift is a gradual movement upward or downward during the analysis. Some variation is normal, but excessive noise or drift can make small peaks more difficult to distinguish and measure reliably.
The baseline also helps determine where a peak begins and ends, which matters when chromatography software calculates the integrated area of a peak.
📊 READING THE DATA
Don’t look only at the tallest peak. Look underneath it.Ask: Is the baseline reasonably stable? Are smaller peaks clearly distinguishable from background noise?
A perfectly flat baseline isn’t required—the important question is whether baseline variation interferes with reliable detection and integration of the peaks being evaluated.
🔬 RESEARCH NOTE
Modern chromatography software can perform peak detection and integration automatically, but automated does not mean infallible. Integration parameters are part of the analytical method, and unusual or difficult chromatograms may require review by a qualified analyst.
Understanding the Peaks
The peaks are the most recognizable features of an HPLC chromatogram—and usually the first place your eyes go.
A peak forms when material leaving the column produces an increased detector response. As the response rises, reaches a maximum, and falls again, it creates the characteristic chromatographic peak.
Ideally, a well-resolved peak corresponds primarily to one component separated from the others in the sample. A chromatogram may contain one dominant peak along with several smaller peaks, or many peaks of different sizes and retention times.
But interpreting them isn’t as simple as counting peaks.
⚠️ IMPORTANT DISTINCTION
One visible peak does not necessarily mean one component.Two substances that leave the column at nearly the same time can produce overlapping responses—a phenomenon known as co-elution. In some cases, those responses may even appear as a single peak.
Peak Height vs. Peak Area
Peak height measures how far the signal rises above the baseline, while peak area considers the detector response across the entire width of the peak.
For chromatographic purity calculations, integrated peak area is generally more important than simply identifying the tallest peak.
We’ll look at exactly how peak area becomes Area% later in this guide.
Retention Time: Where a Peak Appears
Retention time describes how long it takes for a component to travel through the chromatographic system and reach the detector after the sample is introduced.
If a peak reaches its maximum 6.4 minutes into the run, for example, its retention time may be reported as approximately 6.4 minutes.
Different components can have different retention times because they interact differently with the mobile and stationary phases of the HPLC system. However, retention time also depends on the analytical method—including factors such as column chemistry, mobile-phase composition, flow rate, and temperature.
The same compound can appear at different retention times when analyzed using different HPLC methods. The method provides the context for the number.
Can Retention Time Identify a Compound?
When a reference standard and sample are analyzed under the same chromatographic conditions, similar retention behavior can provide evidence supporting identification.
But retention time alone generally cannot establish identity conclusively.
⚠️ IMPORTANT DISTINCTION
Matching retention times do not prove that two substances are identical.Different compounds can sometimes elute at or near the same time. Retention time is therefore best understood as supporting evidence within a defined analytical method, rather than a unique molecular fingerprint.
Peak Area & Integration: Where the Purity Number Comes From
This is where the chromatogram connects to the familiar purity percentage reported on many COAs.
Chromatography software can calculate the area beneath each detected peak, a process called integration. Unlike peak height, integration considers the detector response across the entire width of the peak.
Those integrated areas can then be compared to calculate Area%.
What Is Area%?
In a simplified example, imagine a chromatogram containing four integrated peaks:
| Peak | Integrated Area | Area% |
|---|---|---|
| Main Peak | 990,000 | 99.0% |
| Minor Peak 1 | 5,000 | 0.5% |
| Minor Peak 2 | 3,000 | 0.3% |
| Minor Peak 3 | 2,000 | 0.2% |
| Total | 1,000,000 | 100% |
The main peak accounts for 99% of the total integrated detector response included in the calculation.
Area% = Individual Peak Area ÷ Total Integrated Peak Area × 100
⚠️ IMPORTANT DISTINCTION
99% HPLC Area% does not necessarily mean that 99% of the total material in the sample is the target compound by mass.It means the selected peak accounted for approximately 99% of the integrated chromatographic detector response included in that calculation, under the conditions of that analytical method.
Why Detector Response Matters
Different substances do not necessarily produce identical detector responses. With UV detection, for example, response depends partly on how strongly a compound absorbs light at the wavelength being monitored.
For quantitative measurements, laboratories may use reference standards, calibration curves, or response factors to relate detector response more directly to concentration.
🔬 RESEARCH NOTE
Area% is fundamentally a relative comparison of integrated detector responses. Its meaning depends on the detector, analytical method, integration parameters, and calculation used.
What About Peaks That Aren’t Integrated?
Not every fluctuation in the chromatogram is necessarily included in the calculation. Analytical methods can use detection and integration parameters to distinguish peaks from ordinary baseline noise.
Likewise, a substance that does not produce a response under the detector conditions will not appear simply because it is present.
⚠️ IMPORTANT DISTINCTION
HPLC Area% is not an inventory of every substance present in the material.Water, counterions, some solvents, and other components may require different analytical approaches depending on the method and detector used.
This is why chromatographic purity and total material composition are different analytical concepts.
📊 READING THE DATA
When you see a result such as HPLC Purity: 99.4%, don’t ask only, “Is 99.4% good?”Ask: “What exactly does that 99.4% represent?”
Minor Peaks, Overlapping Peaks & Resolution
Smaller peaks represent additional detector responses occurring during the analysis. Depending on the method and sample, they may be associated with impurities, degradation products, other detectable components, or analytical artifacts.
Their presence alone does not establish what those substances are or whether they are significant.
Where interpretation becomes especially important is when peaks occur close together. Ideally, individual components are separated well enough to produce distinct peaks. When separation is incomplete, peaks may partially overlap, appear as shoulders, or—in some cases—co-elute closely enough to resemble a single peak.
This is where resolution matters. Resolution describes how effectively neighboring chromatographic peaks are separated from one another.
⚠️ IMPORTANT DISTINCTION
One visible peak does not necessarily represent one component. If two substances co-elute, their detector responses may overlap enough to appear as a single chromatographic peak.
📊 READING THE DATA
Don’t judge a chromatogram only by the size of its main peak. Look at the surrounding trace. Are neighboring peaks clearly separated? Are there shoulders or overlapping signals? Are smaller peaks distinguishable from baseline noise?
Key Takeaways
An HPLC chromatogram is a visual record of detector response over time during a chromatographic separation.
The X-axis typically represents retention time, while the Y-axis represents detector response.
Retention time tells you when a component produced a detector response under the specific analytical conditions used. It can support identification, but it does not prove identity on its own.
Peak area measures the integrated detector response associated with a peak and is commonly used to calculate chromatographic Area%.
A reported result such as 99% HPLC Area% does not automatically mean that 99% of the total sample mass is the target compound. It describes the relative integrated detector response included in that analysis.
Minor peaks are not automatically contaminants. Their identity and significance cannot necessarily be determined from the chromatogram alone.
Good resolution helps separate neighboring components so individual peaks can be evaluated more reliably. Overlapping or co-eluting components can complicate interpretation.
A chromatogram should always be interpreted alongside the analytical method and accompanying report, rather than judged by one peak or percentage alone.
🔬 RESEARCH NOTE
HPLC is powerful because it can separate components and reveal their chromatographic behavior—but no single analytical technique answers every question about a sample. Understanding what a test doesn’t establish is just as important as understanding what it does.
Continue Your Research....
How to Read a COA
3X vs 15X Testing
How to Read a Scientific Paper
Understanding Purity Percentages
What is HPLC?
References & Further Reading
International Union of Pure and Applied Chemistry (IUPAC). Compendium of Chemical Terminology (the “Gold Book”): Chromatography Terminology.
Useful reference for standardized chromatography terminology, including baseline and retention measurements
IUPAC Gold Book
Agilent Technologies. OpenLab CDS Data Analysis Reference Guide.
Technical reference covering chromatographic data analysis, peak integration, peak area measurement, and related calculations.
Agilent OpenLab CDS Data Analysis Reference Guide
U.S. Food and Drug Administration (FDA). Q2(R2) Validation of Analytical Procedures. March 2024.
Current ICH/FDA framework covering validation principles for analytical procedures and the reliability of analytical results.
FDA Q2(R2) Validation of Analytical Procedures
U.S. Food and Drug Administration (FDA). Q14 Analytical Procedure Development. March 2024.
Guidance addressing science-based analytical procedure development and the importance of understanding analytical method performance.
FDA Q14 Analytical Procedure Development
U.S. Food and Drug Administration (FDA). Q6A Specifications: Test Procedures and Acceptance Criteria for New Drug Substances and New Drug Products.
Particularly useful for understanding the distinction between chromatographic retention behavior and chemical identification. FDA specifically notes that identification based solely on a single chromatographic retention time is not considered sufficiently specific.
FDA Q6A Specifications and Test Procedures
U.S. Food and Drug Administration (FDA). Analytical Procedures and Methods Validation for Drugs and Biologics.
Provides broader context for analytical methods used to evaluate identity, strength, quality, purity, and potency and reinforces why analytical results must be interpreted within the capabilities of the method used.
FDA Analytical Procedures and Methods Validation
Research Disclaimer
The information provided in this guide is intended solely for educational and research purposes. It is designed to help readers understand common laboratory analytical terminology and should not be interpreted as medical advice or as a statement regarding the safety, efficacy, or intended use of any research material.