

HPLC vs Mass Spectrometry
AT A GLANCE
Reading Time: 5 minutes
You’ll Learn
You’ll Learn
- What HPLC actually measures and what a purity percentage represents
- What mass spectrometry measures and how molecular mass can support compound identification
- Why purity and identity are not the same thing
- Why HPLC and mass spectrometry are often used together
- What to look for when both results appear on a COA
What Does Each Test Actually Tell You?
When reviewing a Certificate of Analysis (COA), you may see results from both HPLC and mass spectrometry (MS). These tests are often presented together, but they answer different analytical questions.
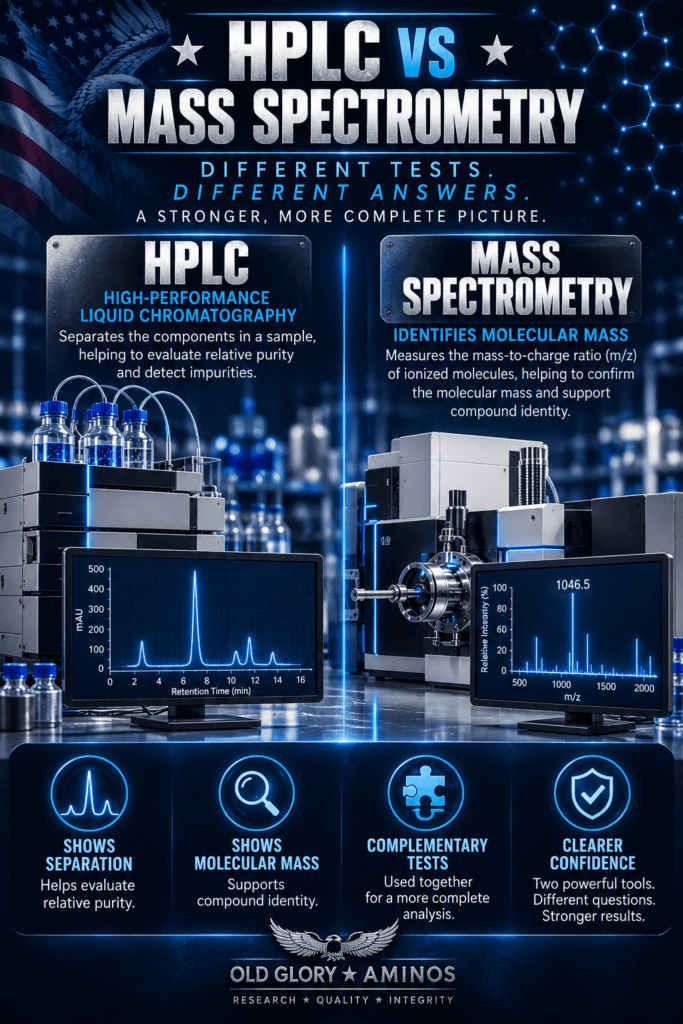
In simple terms, HPLC helps evaluate how the components of a sample separate and can be used to assess relative purity, while mass spectrometry provides information about molecular mass that can help support the identity of a compound.
That distinction matters.
A sample can produce a very clean-looking HPLC chromatogram without HPLC alone proving exactly what the primary component is. Likewise, a mass spectrometry result that matches an expected molecular mass does not, by itself, describe the complete purity profile of the sample.
Used together, however, these techniques provide complementary pieces of analytical evidence.
In this guide, we’ll look at what each test actually measures, what its results can—and cannot—tell you, and how to interpret the two when they appear together on a COA.
HPLC: Separation & Purity
High-Performance Liquid Chromatography (HPLC) separates the different components present in a sample. As those components move through the chromatography column, they interact differently with the column material and typically emerge at different times, producing individual peaks on a chromatogram.
For purity testing, the laboratory compares the area of the primary peak with the total area of the detected peaks. If the main peak accounts for 99% of the measured peak area under the test conditions, the result may be reported as approximately 99% HPLC purity.
📊 READING THE DATA
A large primary peak accompanied by much smaller peaks generally indicates that one detected component dominates the sample. Those smaller peaks may represent impurities, degradation products, related compounds, or other substances detectable under the method conditions.
⚠️ IMPORTANT DISTINCTION
A high HPLC purity result does not automatically prove the identity of the main component. HPLC is excellent at showing how a sample separates and assessing relative chromatographic purity—but a dominant peak still needs additional evidence to establish what that component actually is.
That is where mass spectrometry becomes especially useful.
Want a deeper look at the chromatogram itself?
See our guide: How to Read an HPLC Chromatogram: Peaks, Retention Time & Purity
Mass Spectrometry: Molecular Mass & Identity
Mass spectrometry (MS) approaches the sample from a different angle. Instead of separating components based on how they travel through a chromatography system, MS ionizes molecules and measures their mass-to-charge ratio (m/z).
The resulting mass spectrum contains peaks representing detected ions. Researchers can compare those signals with the values expected for the compound being analyzed.
🔬 RESEARCH NOTE
Mass spectrometry technically measures mass-to-charge ratio, not molecular weight directly. Because molecules can carry different electrical charges, interpreting an MS result may involve determining which charge state produced a particular peak.
📊 READING THE DATA
On a COA, you may see an expected molecular mass alongside an observed mass or m/z value. A result consistent with the expected value provides evidence that the analyzed material has the molecular mass anticipated for the compound being tested.
But just as HPLC has limits, so does mass spectrometry: a matching mass does not, by itself, tell you the sample’s overall purity.
Why Labs Often Use Both
HPLC and mass spectrometry are often used together because they provide complementary information about a sample.
HPLC can show whether one component dominates the chromatographic profile and reveal additional detected components. Mass spectrometry can then provide molecular-mass information that helps determine whether the material is consistent with the compound researchers expect.
🔬 RESEARCH NOTE
When chromatography is directly coupled with mass spectrometry—such as LC-MS—the separated components can be analyzed by the mass spectrometer as they leave the chromatography system. This allows researchers to connect chromatographic peaks with corresponding mass-spectral information.
💡 DID YOU KNOW?
This combination helps answer two different questions about the same sample:
HPLC → What does the sample’s separation and purity profile look like?
MS → Does the molecular-mass information support the expected identity?
Neither technique makes the other unnecessary. They strengthen the analytical picture by providing different kinds of evidence.

How to Read HPLC & MS Results on a COA
When both HPLC and mass spectrometry results appear on a Certificate of Analysis, read them as two separate pieces of evidence rather than expecting one result to confirm everything about the sample.
Start with the HPLC result. Look for the reported purity percentage and, when provided, the chromatogram. This gives you information about the sample’s chromatographic purity profile and whether additional components were detected under the test conditions.
Then look at the mass spectrometry result. Compare the reported or observed molecular mass with the expected value for the compound being tested.
📊 READING THE DATA
A simplified way to approach the results:
HPLC: Is there a dominant component, and what percentage of the detected chromatographic signal does it represent?
Mass Spectrometry: Is the observed molecular-mass information consistent with what is expected for the compound?
Together: Do the purity profile and molecular-mass evidence support the laboratory’s reported result?
⚠️ IMPORTANT DISTINCTION
Analytical results should always be interpreted within the context of the specific method used. A single percentage, peak, or matching mass should not be treated as a complete characterization of a sample.
For most readers, though, the takeaway is wonderfully simple:
HPLC helps answer “How pure?”
Mass spectrometry helps answer “Does the mass support what it is?”
Key Takeaways
HPLC and mass spectrometry answer different analytical questions. HPLC provides information about separation and chromatographic purity, while MS provides molecular-mass information that can support identity.
High purity does not automatically confirm identity. A dominant HPLC peak shows that one detected component makes up most of the chromatographic signal—it does not, by itself, prove what that component is.
A matching molecular mass does not automatically establish purity. Mass spectrometry provides important identity-related evidence, but it does not replace a chromatographic purity assessment.
Using HPLC and MS together provides a more complete analytical picture. One evaluates the sample’s chromatographic profile; the other provides complementary molecular-mass evidence.
Always interpret results in context. The analytical method, testing conditions, and complete COA matter more than any single number or peak.
The simplest way to remember it:
HPLC → How pure does the sample appear under the test conditions?
Mass Spectrometry → Does the molecular mass support the expected identity?
Together → Stronger evidence about what’s actually in the sample.
Continue Your Research...
What is HPLC?
How to Read a COA
Understanding Purity Percentages
How to Read an HPLC Chromatogram
References
1. U.S. Food and Drug Administration (FDA).
Q6A Specifications: Test Procedures and Acceptance Criteria for New Drug Substances and New Drug Products: Chemical Substances.
International Council for Harmonisation (ICH), 2000.
Especially relevant to our distinction between identity and purity: the guidance states that identification using a single chromatographic retention time is not sufficiently specific and identifies combined techniques such as HPLC/MS as generally acceptable approaches.
FDA — Q6A Guidance
2. United States Pharmacopeia (USP).
General Chapter <621> Chromatography. USP–NF.
Provides the underlying principles and terminology for chromatographic separation, including high-performance liquid chromatography (HPLC).
USP — General Chapter <621> Chromatography
3. International Union of Pure and Applied Chemistry (IUPAC).
Compendium of Chemical Terminology (Gold Book): Mass-to-Charge Ratio.
Defines m/z, the quantity used to characterize ions in mass spectrometry.
IUPAC Gold Book — Mass-to-Charge Ratio
4. International Union of Pure and Applied Chemistry (IUPAC).
Compendium of Chemical Terminology (Gold Book): Mass Spectrum.
Defines a mass spectrum as the spectrum obtained when ions are separated according to their m/z values.
IUPAC Gold Book — Mass Spectrum
5. National Institute of Standards and Technology (NIST).
Mass Spectral Library / Chemical Fingerprints for Compound Identification.
Explains how mass spectrometry generates characteristic spectral patterns from ions separated according to m/z, and how those spectra can be used in compound identification.
NIST — Mass Spectral Library and Chemical Identification
Suggested Research Library disclaimer
Since we’re standardizing the articles, I would put the same short note underneath every reference section:
Research & Educational Use: This article is intended for general scientific education and research reference. Analytical results should be interpreted in the context of the specific test method, instrumentation, laboratory procedures, and complete Certificate of Analysis.
Research Disclaimer
The information provided in this guide is intended solely for educational and research purposes. It is designed to help readers understand common laboratory analytical terminology and should not be interpreted as medical advice or as a statement regarding the safety, efficacy, or intended use of any research material.
HPLC vs Mass Spectrometry
At a Glance
Reading Time: 5 minutes
You’ll Learn
- What HPLC actually measures and what a purity percentage represents
- What mass spectrometry measures and how molecular mass can support compound identification
- Why purity and identity are not the same thing
- Why HPLC and mass spectrometry are often used together
- What to look for when both results appear on a COA
What Does Each Test Actually Tell You?
When reviewing a Certificate of Analysis (COA), you may see results from both HPLC and mass spectrometry (MS). These tests are often presented together, but they answer different analytical questions.
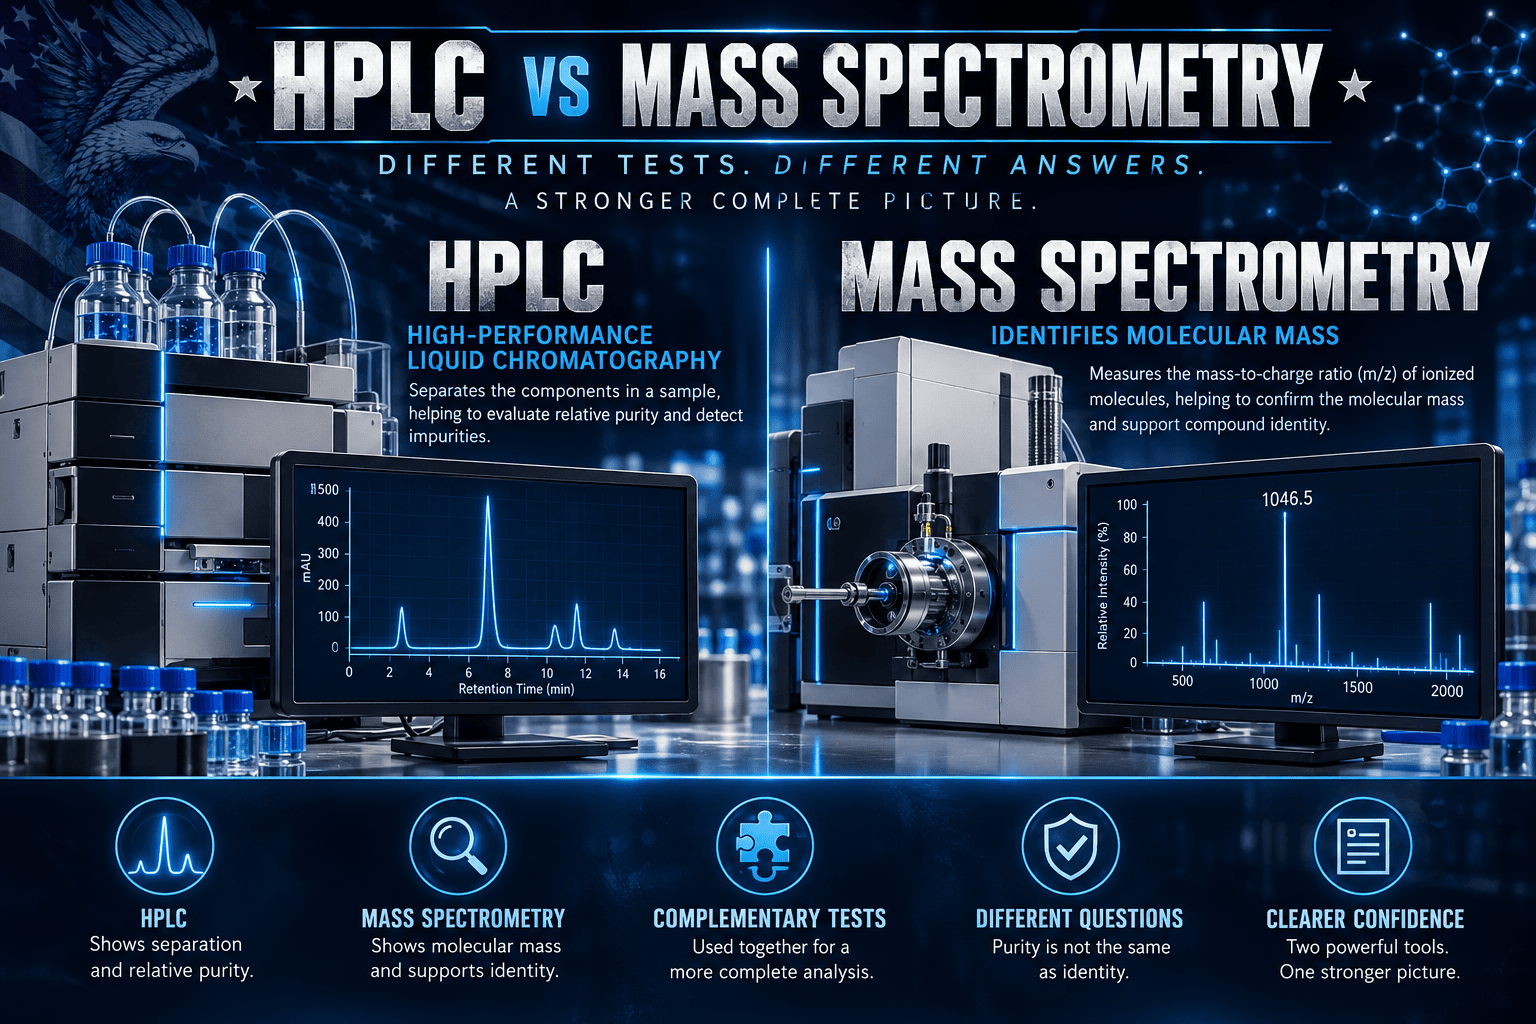
In simple terms, HPLC helps evaluate how the components of a sample separate and can be used to assess relative purity, while mass spectrometry provides information about molecular mass that can help support the identity of a compound.
That distinction matters.
A sample can produce a very clean-looking HPLC chromatogram without HPLC alone proving exactly what the primary component is. Likewise, a mass spectrometry result that matches an expected molecular mass does not, by itself, describe the complete purity profile of the sample.
Used together, however, these techniques provide complementary pieces of analytical evidence.
In this guide, we’ll look at what each test actually measures, what its results can—and cannot—tell you, and how to interpret the two when they appear together on a COA.
HPLC: Separation & Purity
High-Performance Liquid Chromatography (HPLC) separates the different components present in a sample. As those components move through the chromatography column, they interact differently with the column material and typically emerge at different times, producing individual peaks on a chromatogram.
For purity testing, the laboratory compares the area of the primary peak with the total area of the detected peaks. If the main peak accounts for 99% of the measured peak area under the test conditions, the result may be reported as approximately 99% HPLC purity.
📊 READING THE DATA
A large primary peak accompanied by much smaller peaks generally indicates that one detected component dominates the sample. Those smaller peaks may represent impurities, degradation products, related compounds, or other substances detectable under the method conditions.
⚠️ IMPORTANT DISTINCTION
A high HPLC purity result does not automatically prove the identity of the main component. HPLC is excellent at showing how a sample separates and assessing relative chromatographic purity—but a dominant peak still needs additional evidence to establish what that component actually is.
That is where mass spectrometry becomes especially useful.
Want a deeper look at the chromatogram itself?
See our guide: How to Read an HPLC Chromatogram: Peaks, Retention Time & Purity
Mass Spectrometry: Molecular Mass & Identity
Mass spectrometry (MS) approaches the sample from a different angle. Instead of separating components based on how they travel through a chromatography system, MS ionizes molecules and measures their mass-to-charge ratio (m/z).
The resulting mass spectrum contains peaks representing detected ions. Researchers can compare those signals with the values expected for the compound being analyzed.
🔬 RESEARCH NOTE
Mass spectrometry technically measures mass-to-charge ratio, not molecular weight directly. Because molecules can carry different electrical charges, interpreting an MS result may involve determining which charge state produced a particular peak.
📊 READING THE DATA
On a COA, you may see an expected molecular mass alongside an observed mass or m/z value. A result consistent with the expected value provides evidence that the analyzed material has the molecular mass anticipated for the compound being tested.
But just as HPLC has limits, so does mass spectrometry: a matching mass does not, by itself, tell you the sample’s overall purity.
Purity Is Not the Same Thing as Identity
This is one of the most important distinctions when reading analytical test results: purity and identity answer two different questions.
An HPLC result may show that one component overwhelmingly dominates the detected sample. But that alone does not establish exactly what that component is.
Mass spectrometry provides another piece of the puzzle by determining whether the detected molecular mass is consistent with the compound expected to be present.
⚠️ IMPORTANT DISTINCTION
A sample could theoretically produce a chromatogram showing 99%+ purity while the dominant component is not the intended compound. High chromatographic purity means the sample is predominantly one detected component under the test conditions—not automatically that it is the correct component.
Think of it this way:
HPLC asks: How clean is the separation?
Mass spectrometry asks: Does the molecular mass support the expected identity?
Neither result tells the entire story alone.
Together, however, they provide much stronger analytical evidence—which brings us neatly to:
Why Labs Often Use Both
HPLC and mass spectrometry are often used together because they provide complementary information about a sample.
HPLC can show whether one component dominates the chromatographic profile and reveal additional detected components. Mass spectrometry can then provide molecular-mass information that helps determine whether the material is consistent with the compound researchers expect.
🔬 RESEARCH NOTE
When chromatography is directly coupled with mass spectrometry—such as LC-MS—the separated components can be analyzed by the mass spectrometer as they leave the chromatography system. This allows researchers to connect chromatographic peaks with corresponding mass-spectral information.
💡 DID YOU KNOW?
This combination helps answer two different questions about the same sample:
HPLC → What does the sample’s separation and purity profile look like?
MS → Does the molecular-mass information support the expected identity?
Neither technique makes the other unnecessary. They strengthen the analytical picture by providing different kinds of evidence.
How to Read HPLC & MS Results on a COA
When both HPLC and mass spectrometry results appear on a Certificate of Analysis, read them as two separate pieces of evidence rather than expecting one result to confirm everything about the sample.
Start with the HPLC result. Look for the reported purity percentage and, when provided, the chromatogram. This gives you information about the sample’s chromatographic purity profile and whether additional components were detected under the test conditions.
Then look at the mass spectrometry result. Compare the reported or observed molecular mass with the expected value for the compound being tested.
📊 READING THE DATA
A simplified way to approach the results:
HPLC: Is there a dominant component, and what percentage of the detected chromatographic signal does it represent?
Mass Spectrometry: Is the observed molecular-mass information consistent with what is expected for the compound?
Together: Do the purity profile and molecular-mass evidence support the laboratory’s reported result?
⚠️ IMPORTANT DISTINCTION
Analytical results should always be interpreted within the context of the specific method used. A single percentage, peak, or matching mass should not be treated as a complete characterization of a sample.
For most readers, though, the takeaway is wonderfully simple:
HPLC helps answer “How pure?”
Mass spectrometry helps answer “Does the mass support what it is?”
Key Takeaways
HPLC and mass spectrometry answer different analytical questions. HPLC provides information about separation and chromatographic purity, while MS provides molecular-mass information that can support identity.
High purity does not automatically confirm identity. A dominant HPLC peak shows that one detected component makes up most of the chromatographic signal—it does not, by itself, prove what that component is.
A matching molecular mass does not automatically establish purity. Mass spectrometry provides important identity-related evidence, but it does not replace a chromatographic purity assessment.
Using HPLC and MS together provides a more complete analytical picture. One evaluates the sample’s chromatographic profile; the other provides complementary molecular-mass evidence.
Always interpret results in context. The analytical method, testing conditions, and complete COA matter more than any single number or peak.
The simplest way to remember it:
HPLC → How pure does the sample appear under the test conditions?
Mass Spectrometry → Does the molecular mass support the expected identity?
Together → Stronger evidence about what’s actually in the sample.
Continue Your Research....
What Are Amino Acid Compounds?
How to Read a COA
3X vs 15X Testing
Understanding Purity Percentages
How to Read an HPLC Chromatogram
References
1. U.S. Food and Drug Administration (FDA).
Q6A Specifications: Test Procedures and Acceptance Criteria for New Drug Substances and New Drug Products: Chemical Substances.
International Council for Harmonisation (ICH), 2000.
Especially relevant to our distinction between identity and purity: the guidance states that identification using a single chromatographic retention time is not sufficiently specific and identifies combined techniques such as HPLC/MS as generally acceptable approaches.
FDA — Q6A Guidance
2. United States Pharmacopeia (USP).
General Chapter <621> Chromatography. USP–NF.
Provides the underlying principles and terminology for chromatographic separation, including high-performance liquid chromatography (HPLC).
USP — General Chapter <621> Chromatography
3. International Union of Pure and Applied Chemistry (IUPAC).
Compendium of Chemical Terminology (Gold Book): Mass-to-Charge Ratio.
Defines m/z, the quantity used to characterize ions in mass spectrometry.
IUPAC Gold Book — Mass-to-Charge Ratio
4. International Union of Pure and Applied Chemistry (IUPAC).
Compendium of Chemical Terminology (Gold Book): Mass Spectrum.
Defines a mass spectrum as the spectrum obtained when ions are separated according to their m/z values.
IUPAC Gold Book — Mass Spectrum
5. National Institute of Standards and Technology (NIST).
Mass Spectral Library / Chemical Fingerprints for Compound Identification.
Explains how mass spectrometry generates characteristic spectral patterns from ions separated according to m/z, and how those spectra can be used in compound identification.
NIST — Mass Spectral Library and Chemical Identification
Suggested Research Library disclaimer
Since we’re standardizing the articles, I would put the same short note underneath every reference section:
Research & Educational Use: This article is intended for general scientific education and research reference. Analytical results should be interpreted in the context of the specific test method, instrumentation, laboratory procedures, and complete Certificate of Analysis.
Research Disclaimer
The information provided in this guide is intended solely for educational and research purposes. It is designed to help readers understand common laboratory analytical terminology and should not be interpreted as medical advice or as a statement regarding the safety, efficacy, or intended use of any research material.